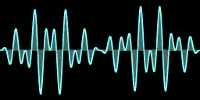
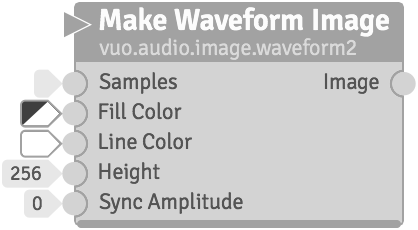
Creates a graph of an audio waveform, where the height of the curve is determined by the amplitude of each audio sample.
Fill Color — The color of the area between the curve and the axis.Line Color — The color of the curve.Height — The output image’s height, in pixels.Sync Amplitude — Used to stabilize the graph, so that the waveform appears to stay in the same place instead of jumping side-to-side with each new audio sample buffer.
The output image’s width is 512 pixels (the size of a sample buffer).
Keywords: amplitudes, oscilloscope